Generate Analytics Reports
Last updated: July 13, 2026
Rella’s Analytics Dashboard
Keeping record of monthly growth, profile metrics, and video engagement helps you prove campaign ROI to clients and identify your top-performing post strategies. Rella lets you generate point-in-time reports (called Analytics Reports) that you can analyze internally or share securely with clients.
About Analytics Reports
Unlike your primary analytics dashboard, which continuously syncs live numbers, an Analytics Report is a static, frozen PDF-style report. It captures your profile growth, demographics, and content performance metrics across a selected date range so you have a stable, historical file for record-keeping or presentation.
Platforms
Each platform tab in Rella’s analytics dashboard shows a tailored set of metrics that reflect what that platform’s API makes available. Click on a platform below for specific metric details.
*At this time, Rella does not provide analytics for Twitter (X) and Google Business.
View Analytics & Generate Reports
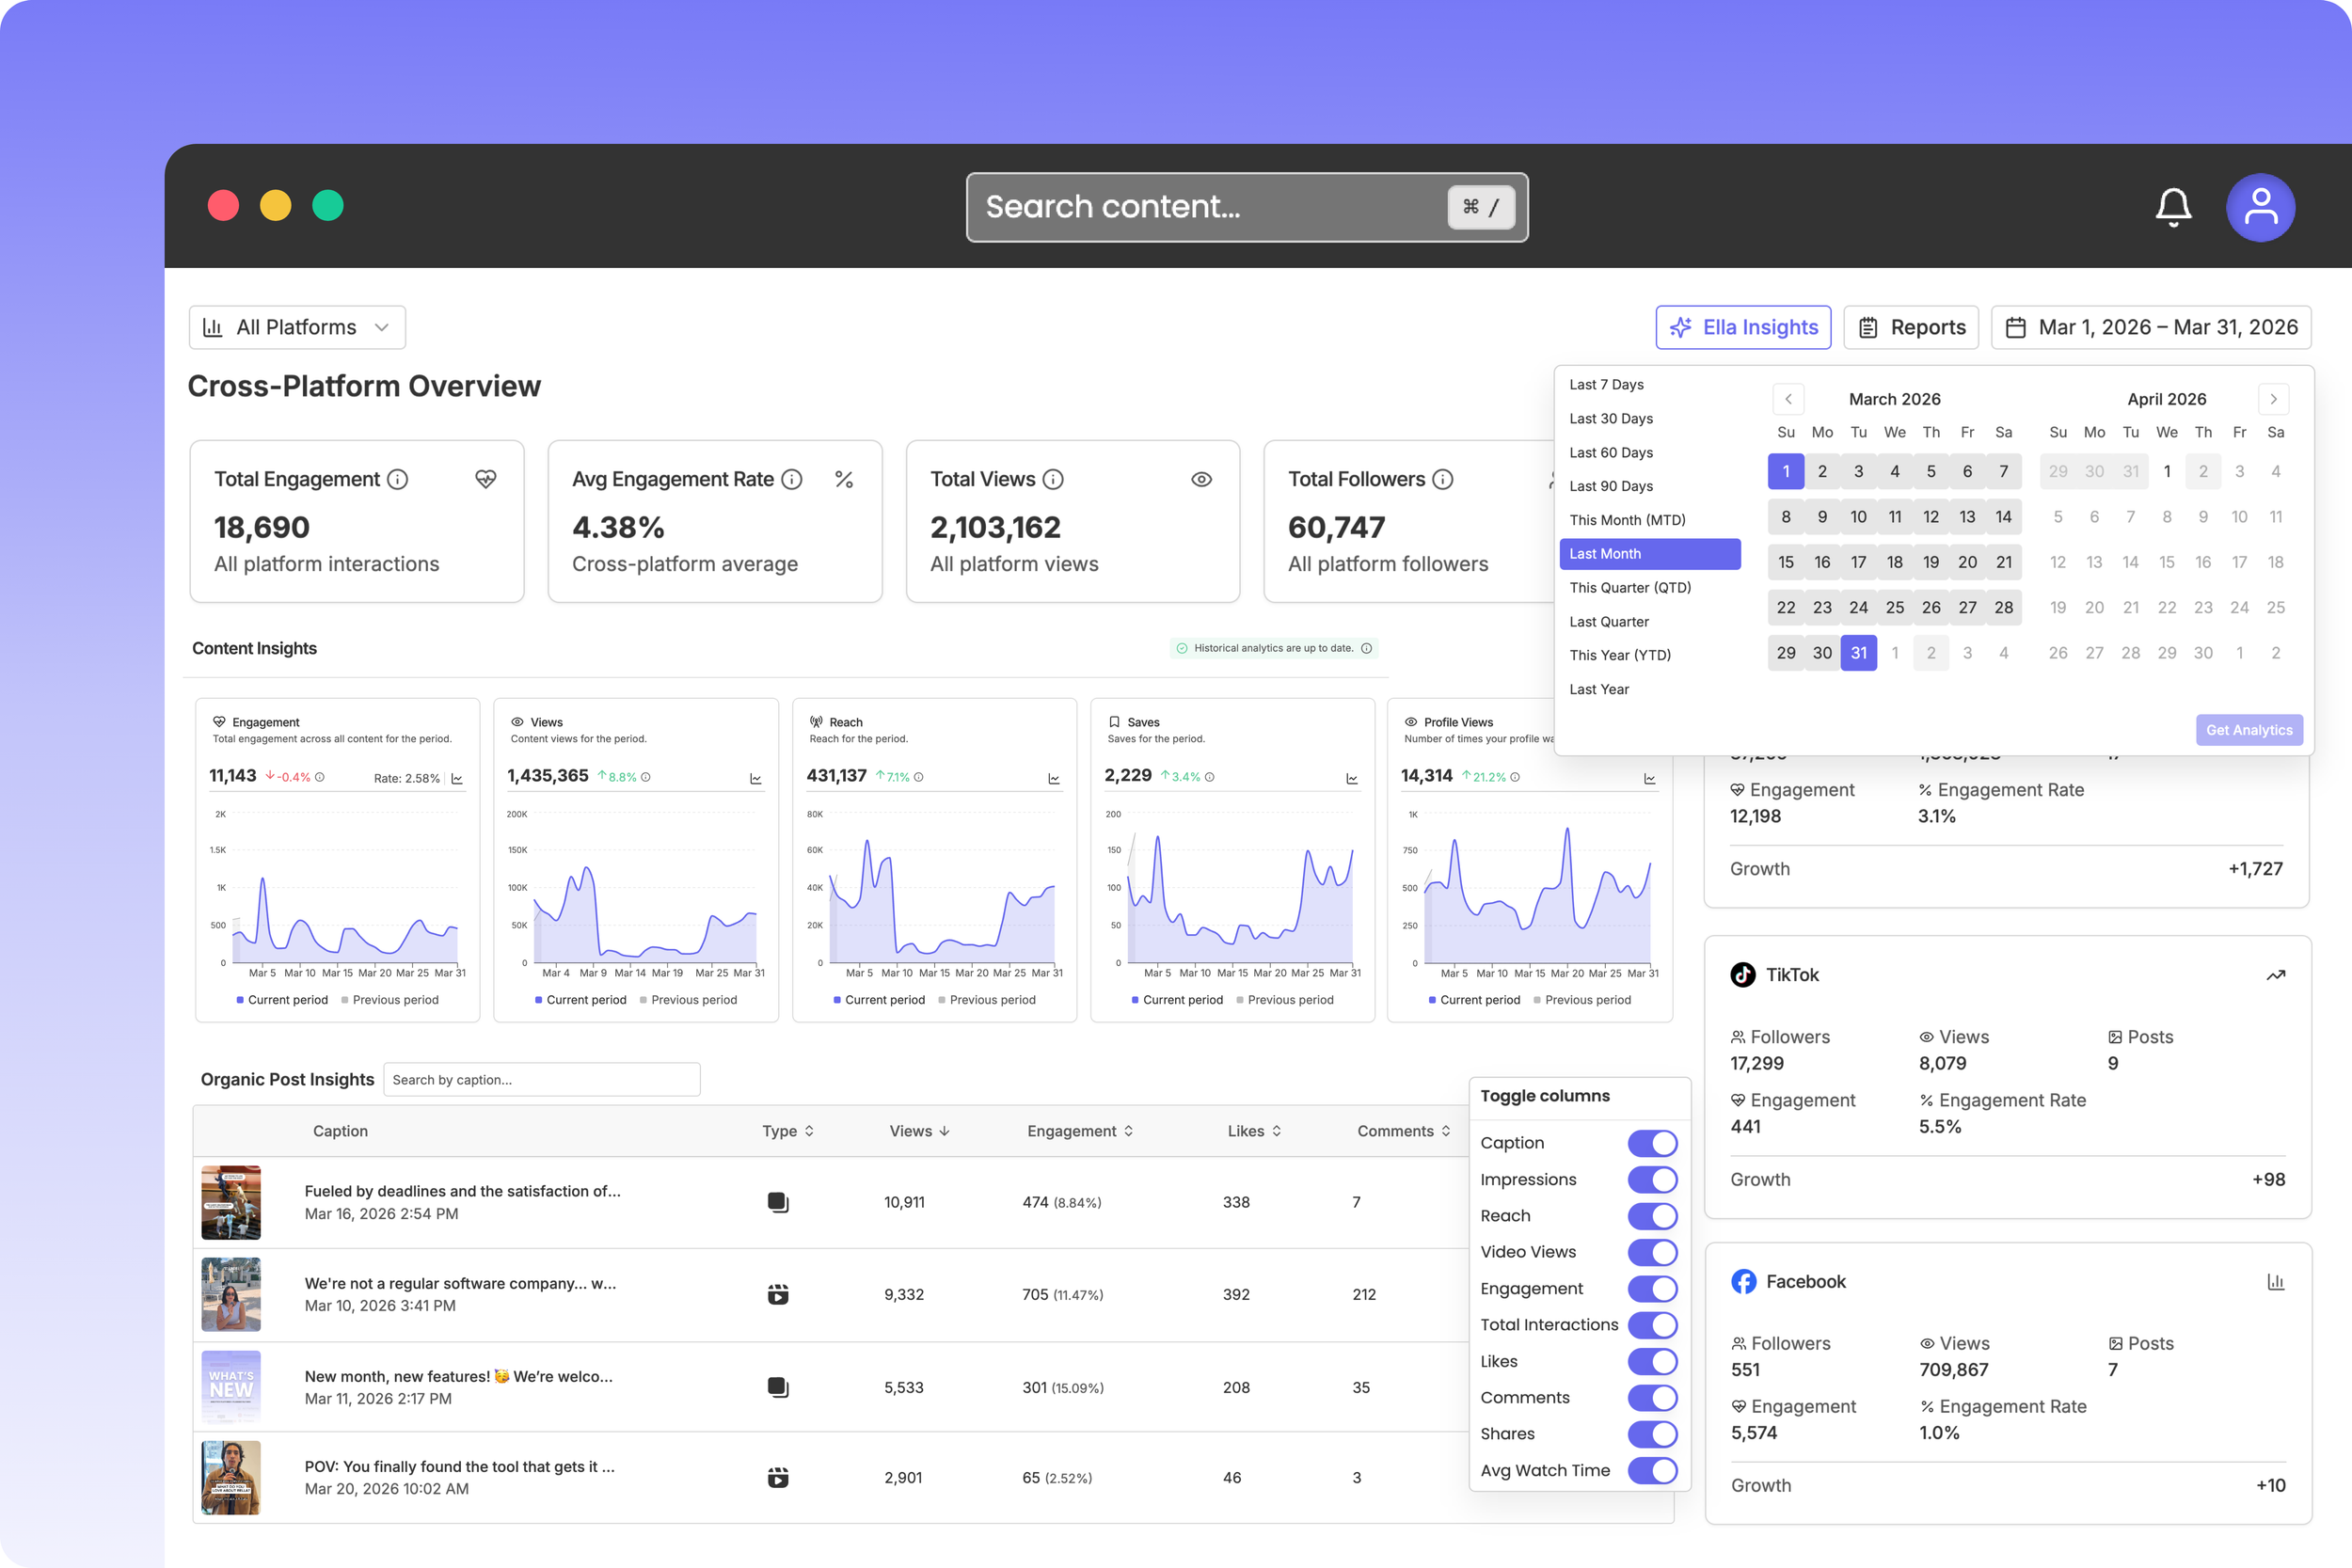
How to Generate an Analytics Report
Steps
Navigate to Analytics in your left sidebar menu.
Configure your desired Date Range and filters at the top of your dashboard.
Click the reports selector dropdown in the top-right header and click Create (the plus icon).
In the report builder panel, customize your settings:
Name: Type a custom title (defaults to your selected date range, such as "Jan 1, 2026 to Jan 31, 2026 metrics").
Platforms: Check the box next to every connected social account you want to include in this report.
AI Analysis: If your Organization is on the Premium plan, you can toggle this on to have Rella's AI assistant, Ella, compile summaries, visual graphs, and content recommendations. (Note: AI-generated analysis is for internal team use only and is hidden from public client views).
Click Create Report.
How to Share Reports with Clients
Once generated, your report is saved in your space's report directory and will not update. You can share this static view with external clients without needing to add them as Rella users.
Steps
Navigate to your Analytics dashboard, click your reports directory, and select your saved report.
In the report header, click Share.
Toggle on the Public Link switch (represented by the globe icon).
Set an Expiration Date (optional) to automatically disable the link after your monthly review window closes.
Choose how to share:
To send via email: Type your client's email address and a custom note in the invite fields, then click Send.
To share manually: Click Copy Link to save the secure URL directly to your clipboard.
What the Client Sees (The Guest View)
When clients open your shared link, they are directed to a clean, non-editable report dashboard:
Brand Isolation: They can interact with graphs, inspect demographic charts, and read post-level metrics for that specific Social Space only.
Locked Data: Clients cannot edit titles, modify date ranges, generate new snapshots, or view adjacent client workspaces.
Hidden AI Insights: Any internal AI-generated summaries, recommendations, or Ella comments are hidden on the public guest link to keep your team's internal strategy private.
Cross-Platform Overview
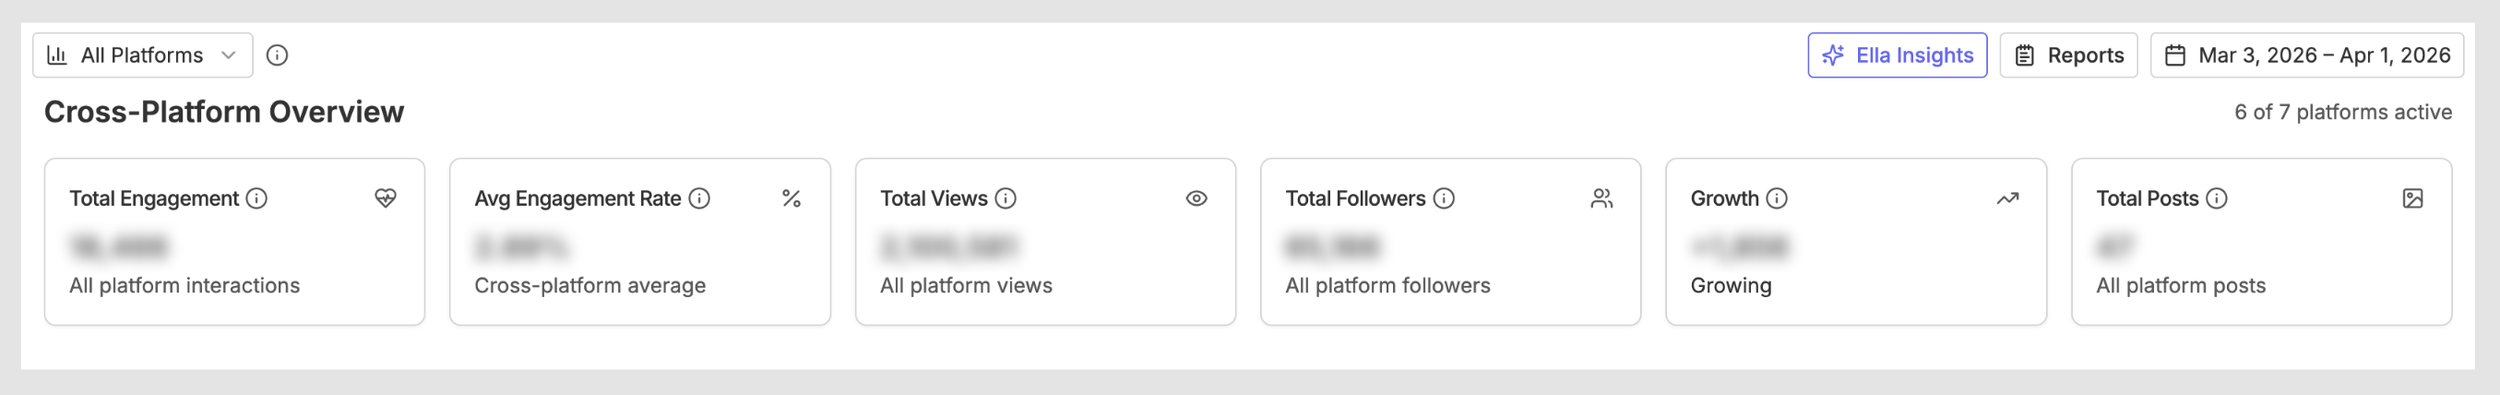
The Cross-Platform Overview gives you an at-a-glance summary of performance across every connected channel. At the top of the dashboard, you’ll find the following cross-platform metrics:
Total Engagement
Average Engagement Rate
Total Views
Total Followers
Follower Growth
Total Posts
Platform Details
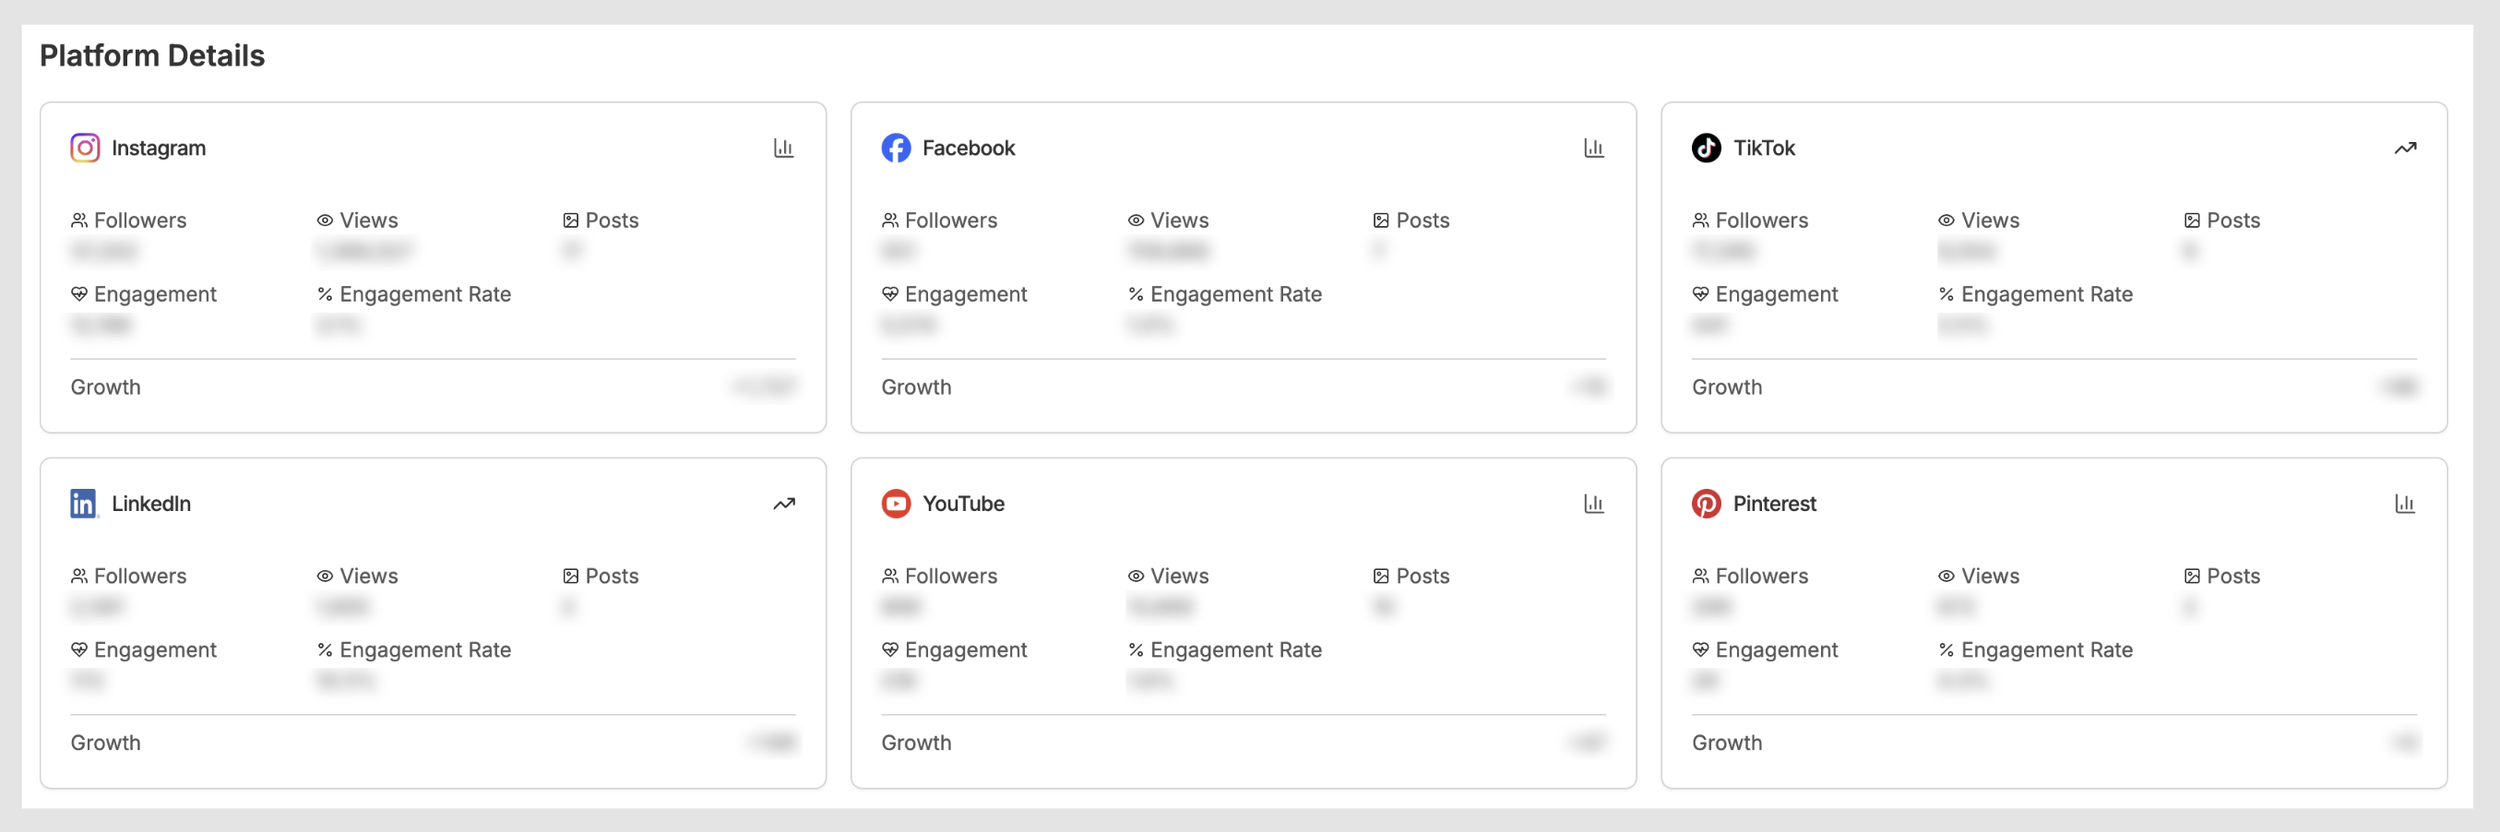
The Platform Details section breaks down key stats for each individual connected platform, including:
Followers
Views
Posts, engagement
Engagement rate and
Growth
Platform Performance Analysis
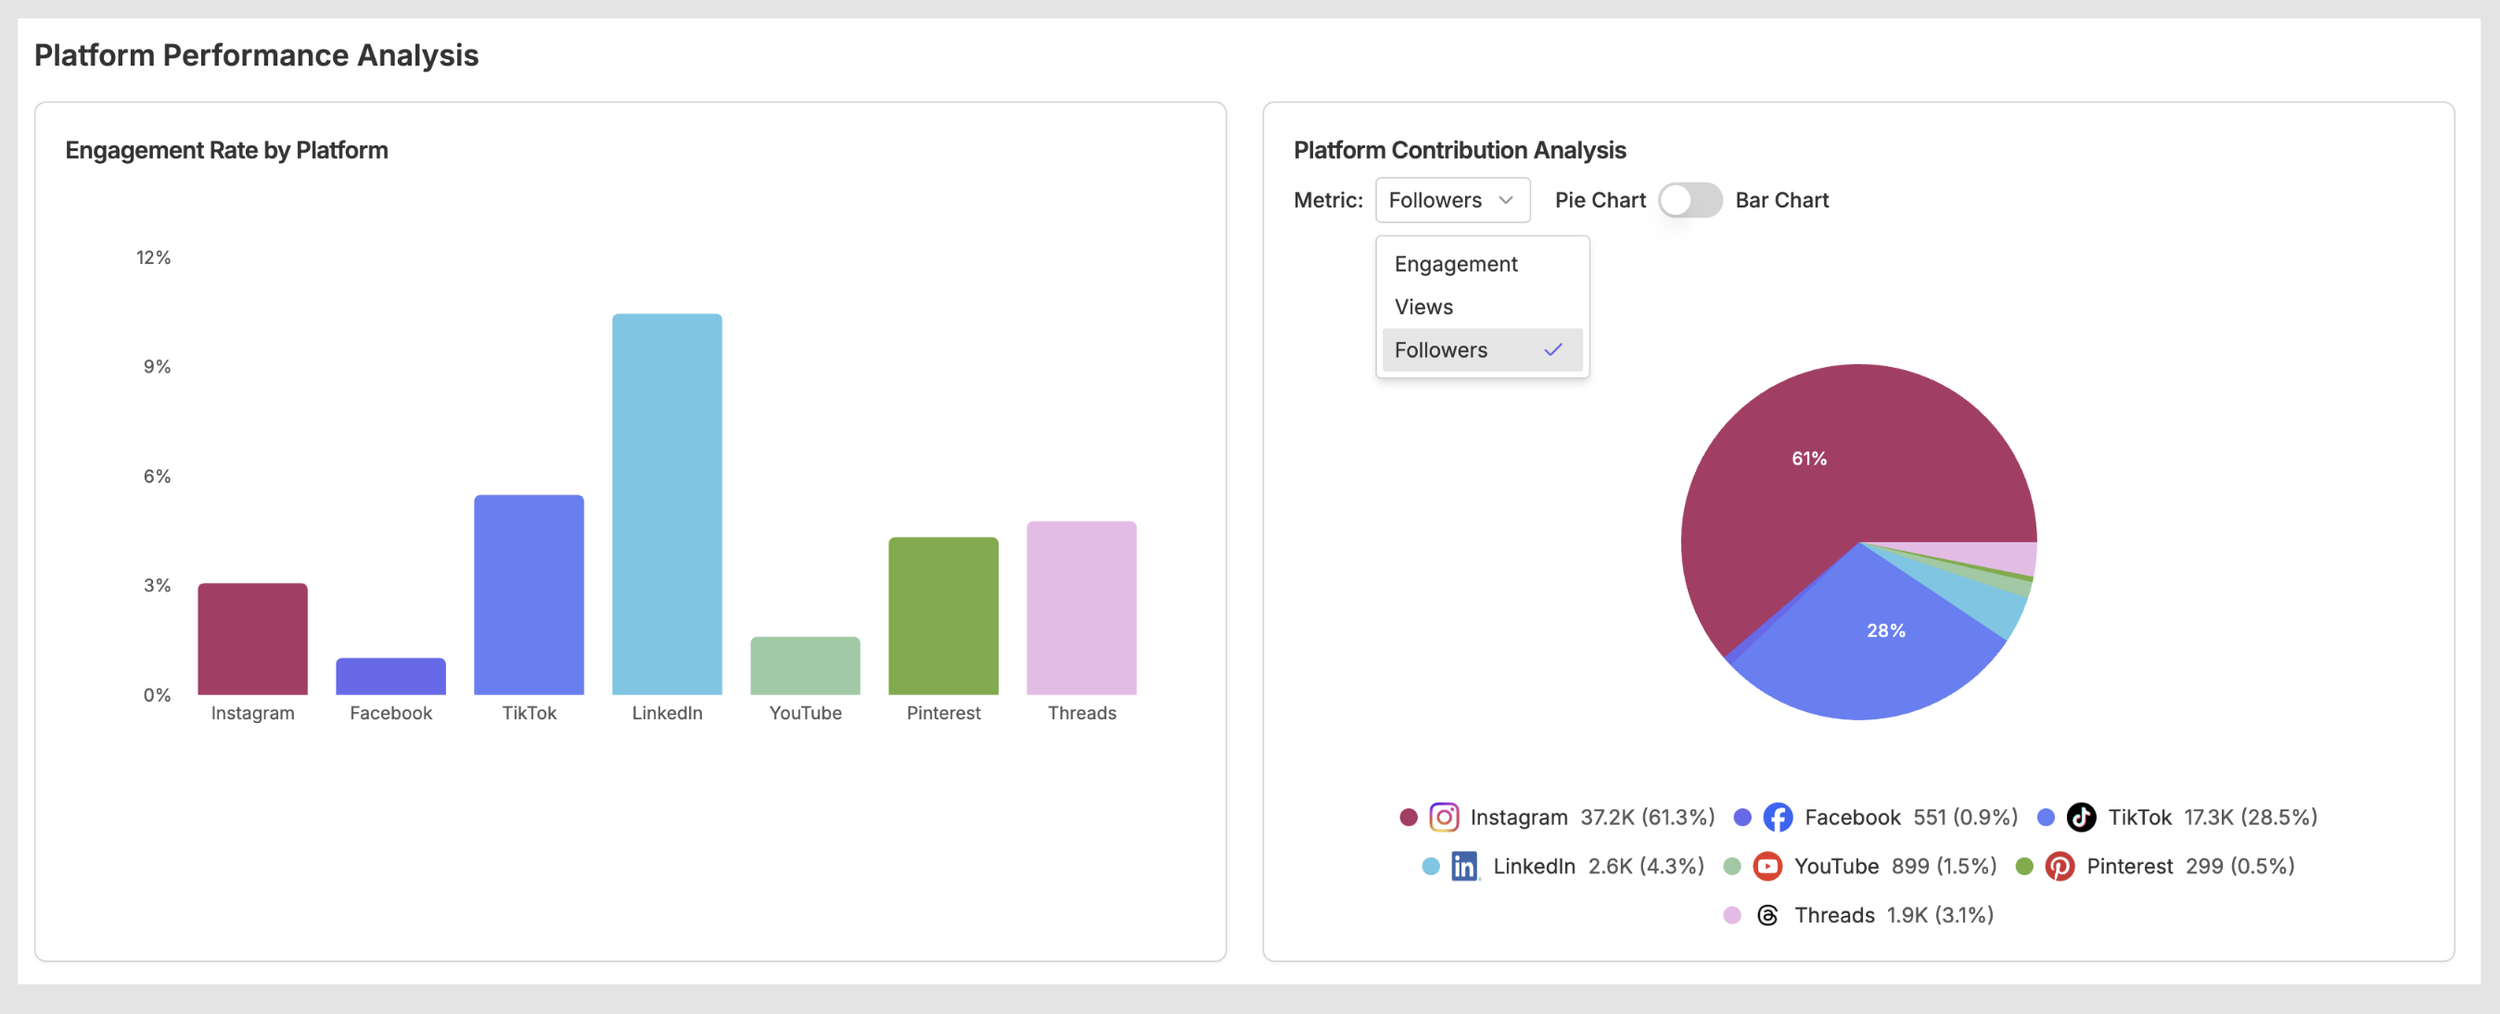
The Platform Performance Analysis section gives you a visual breakdown of how your connected accounts stack up against each other. It includes:
Engagement Rate by Platform to see which channels are driving the most interaction relative to their audience size.
Platform Contribution Analysis lets you toggle between a pie chart and bar chart view to see how each platform contributes to a selected metric. Use the Metric dropdown to switch between Engagement, Views, and Followers.
Top Performing Content Across Platforms
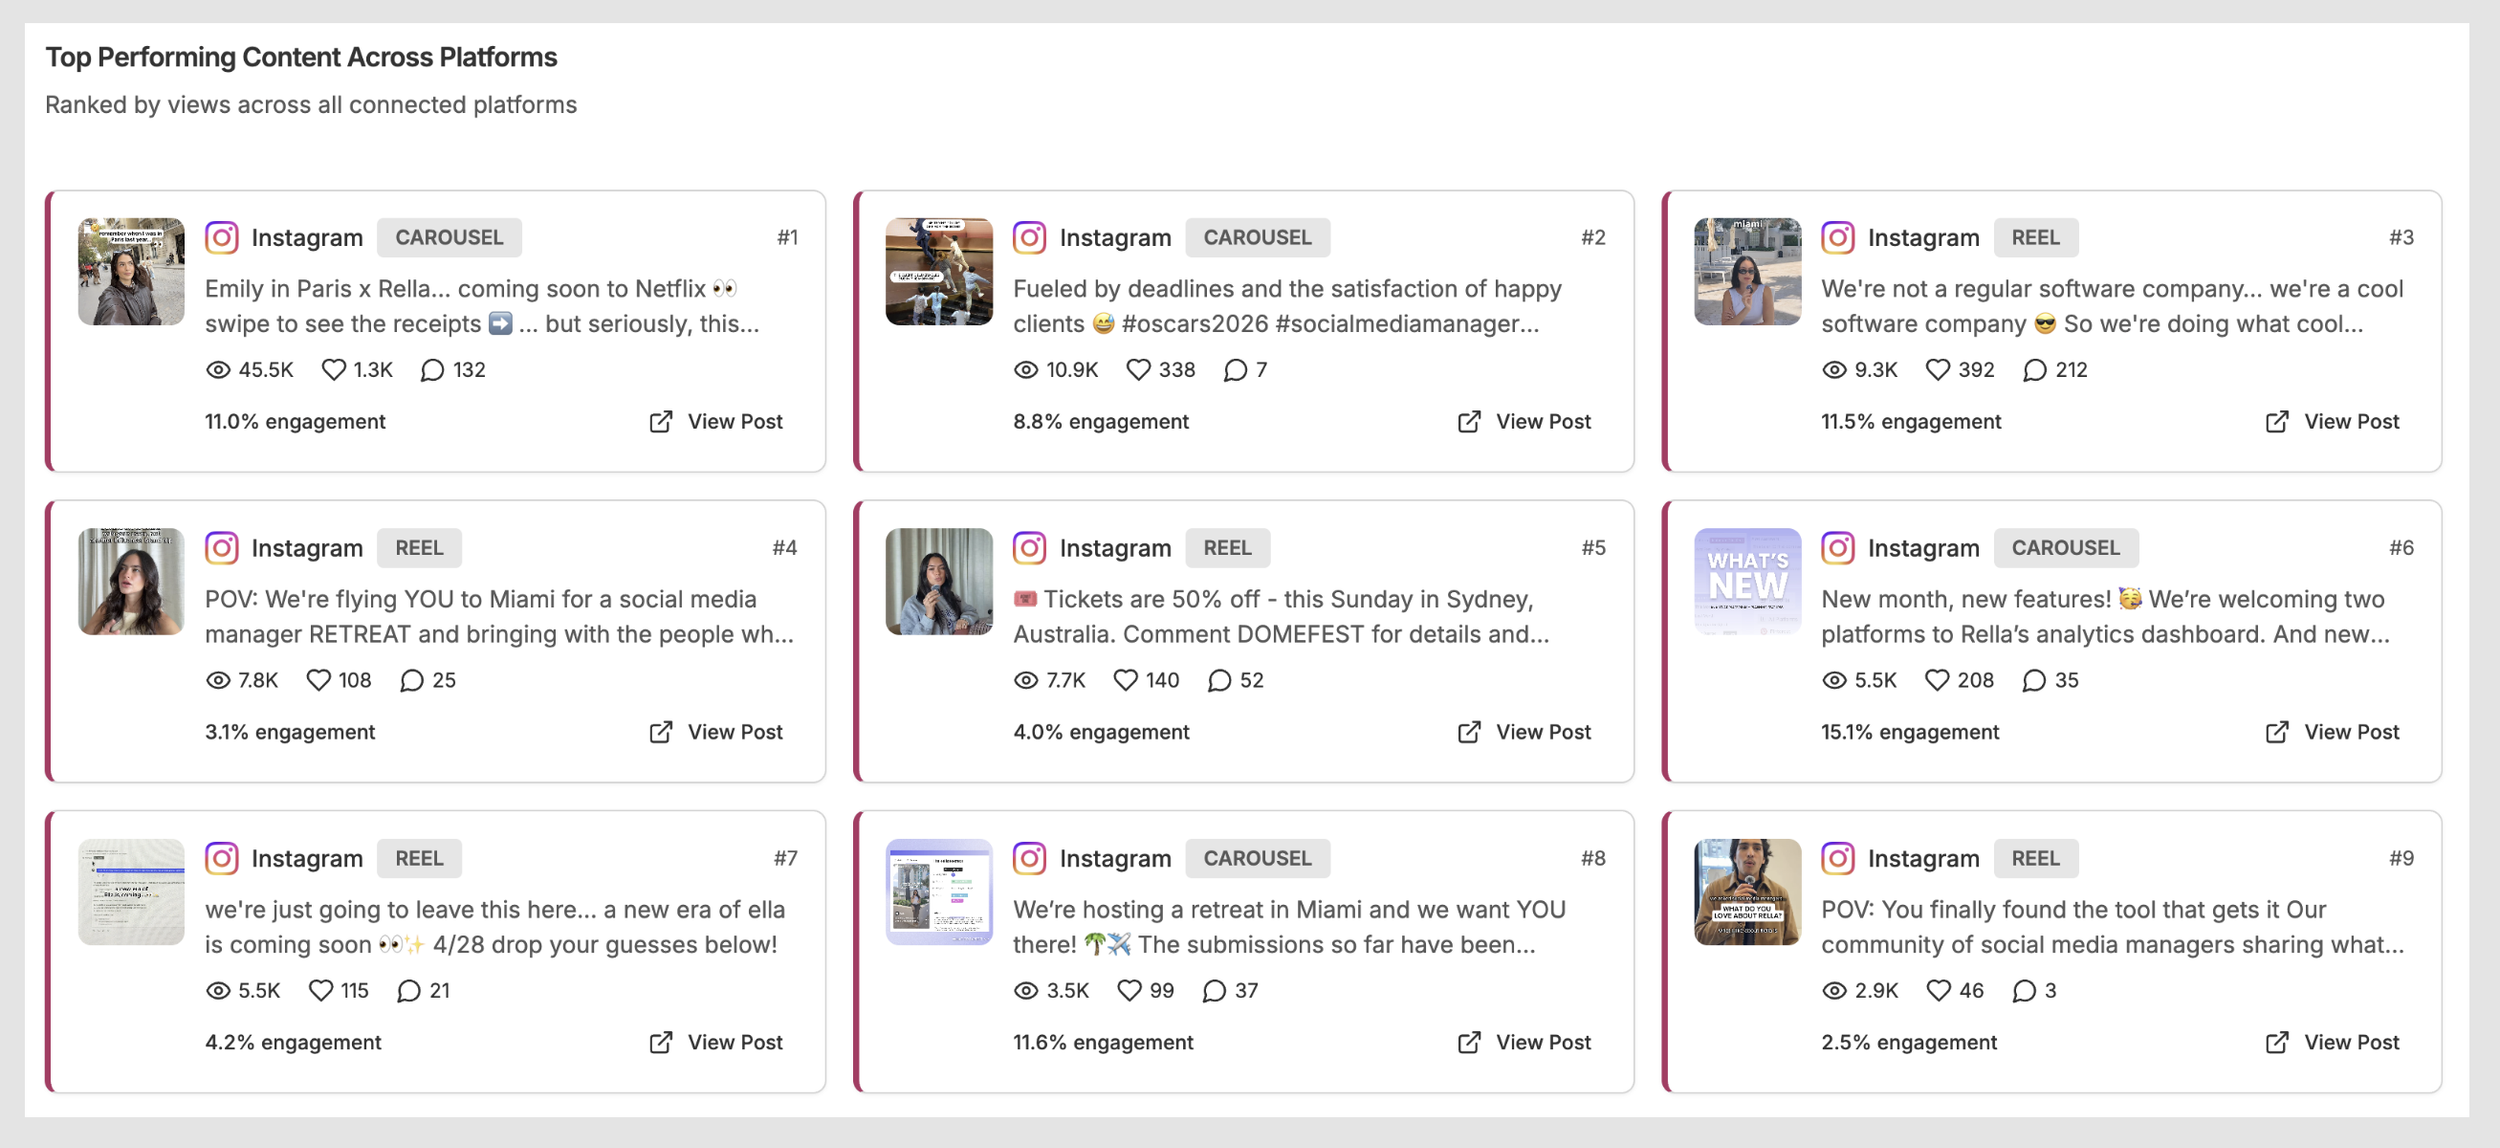
Below Platform Details you’ll see the top 15 performing posts across all connected platforms, ranked by views. This view makes it even easier to spot your best-performing content at a glance and understand what’s resonating with your audience across channels.
AI Insights & Recommendations
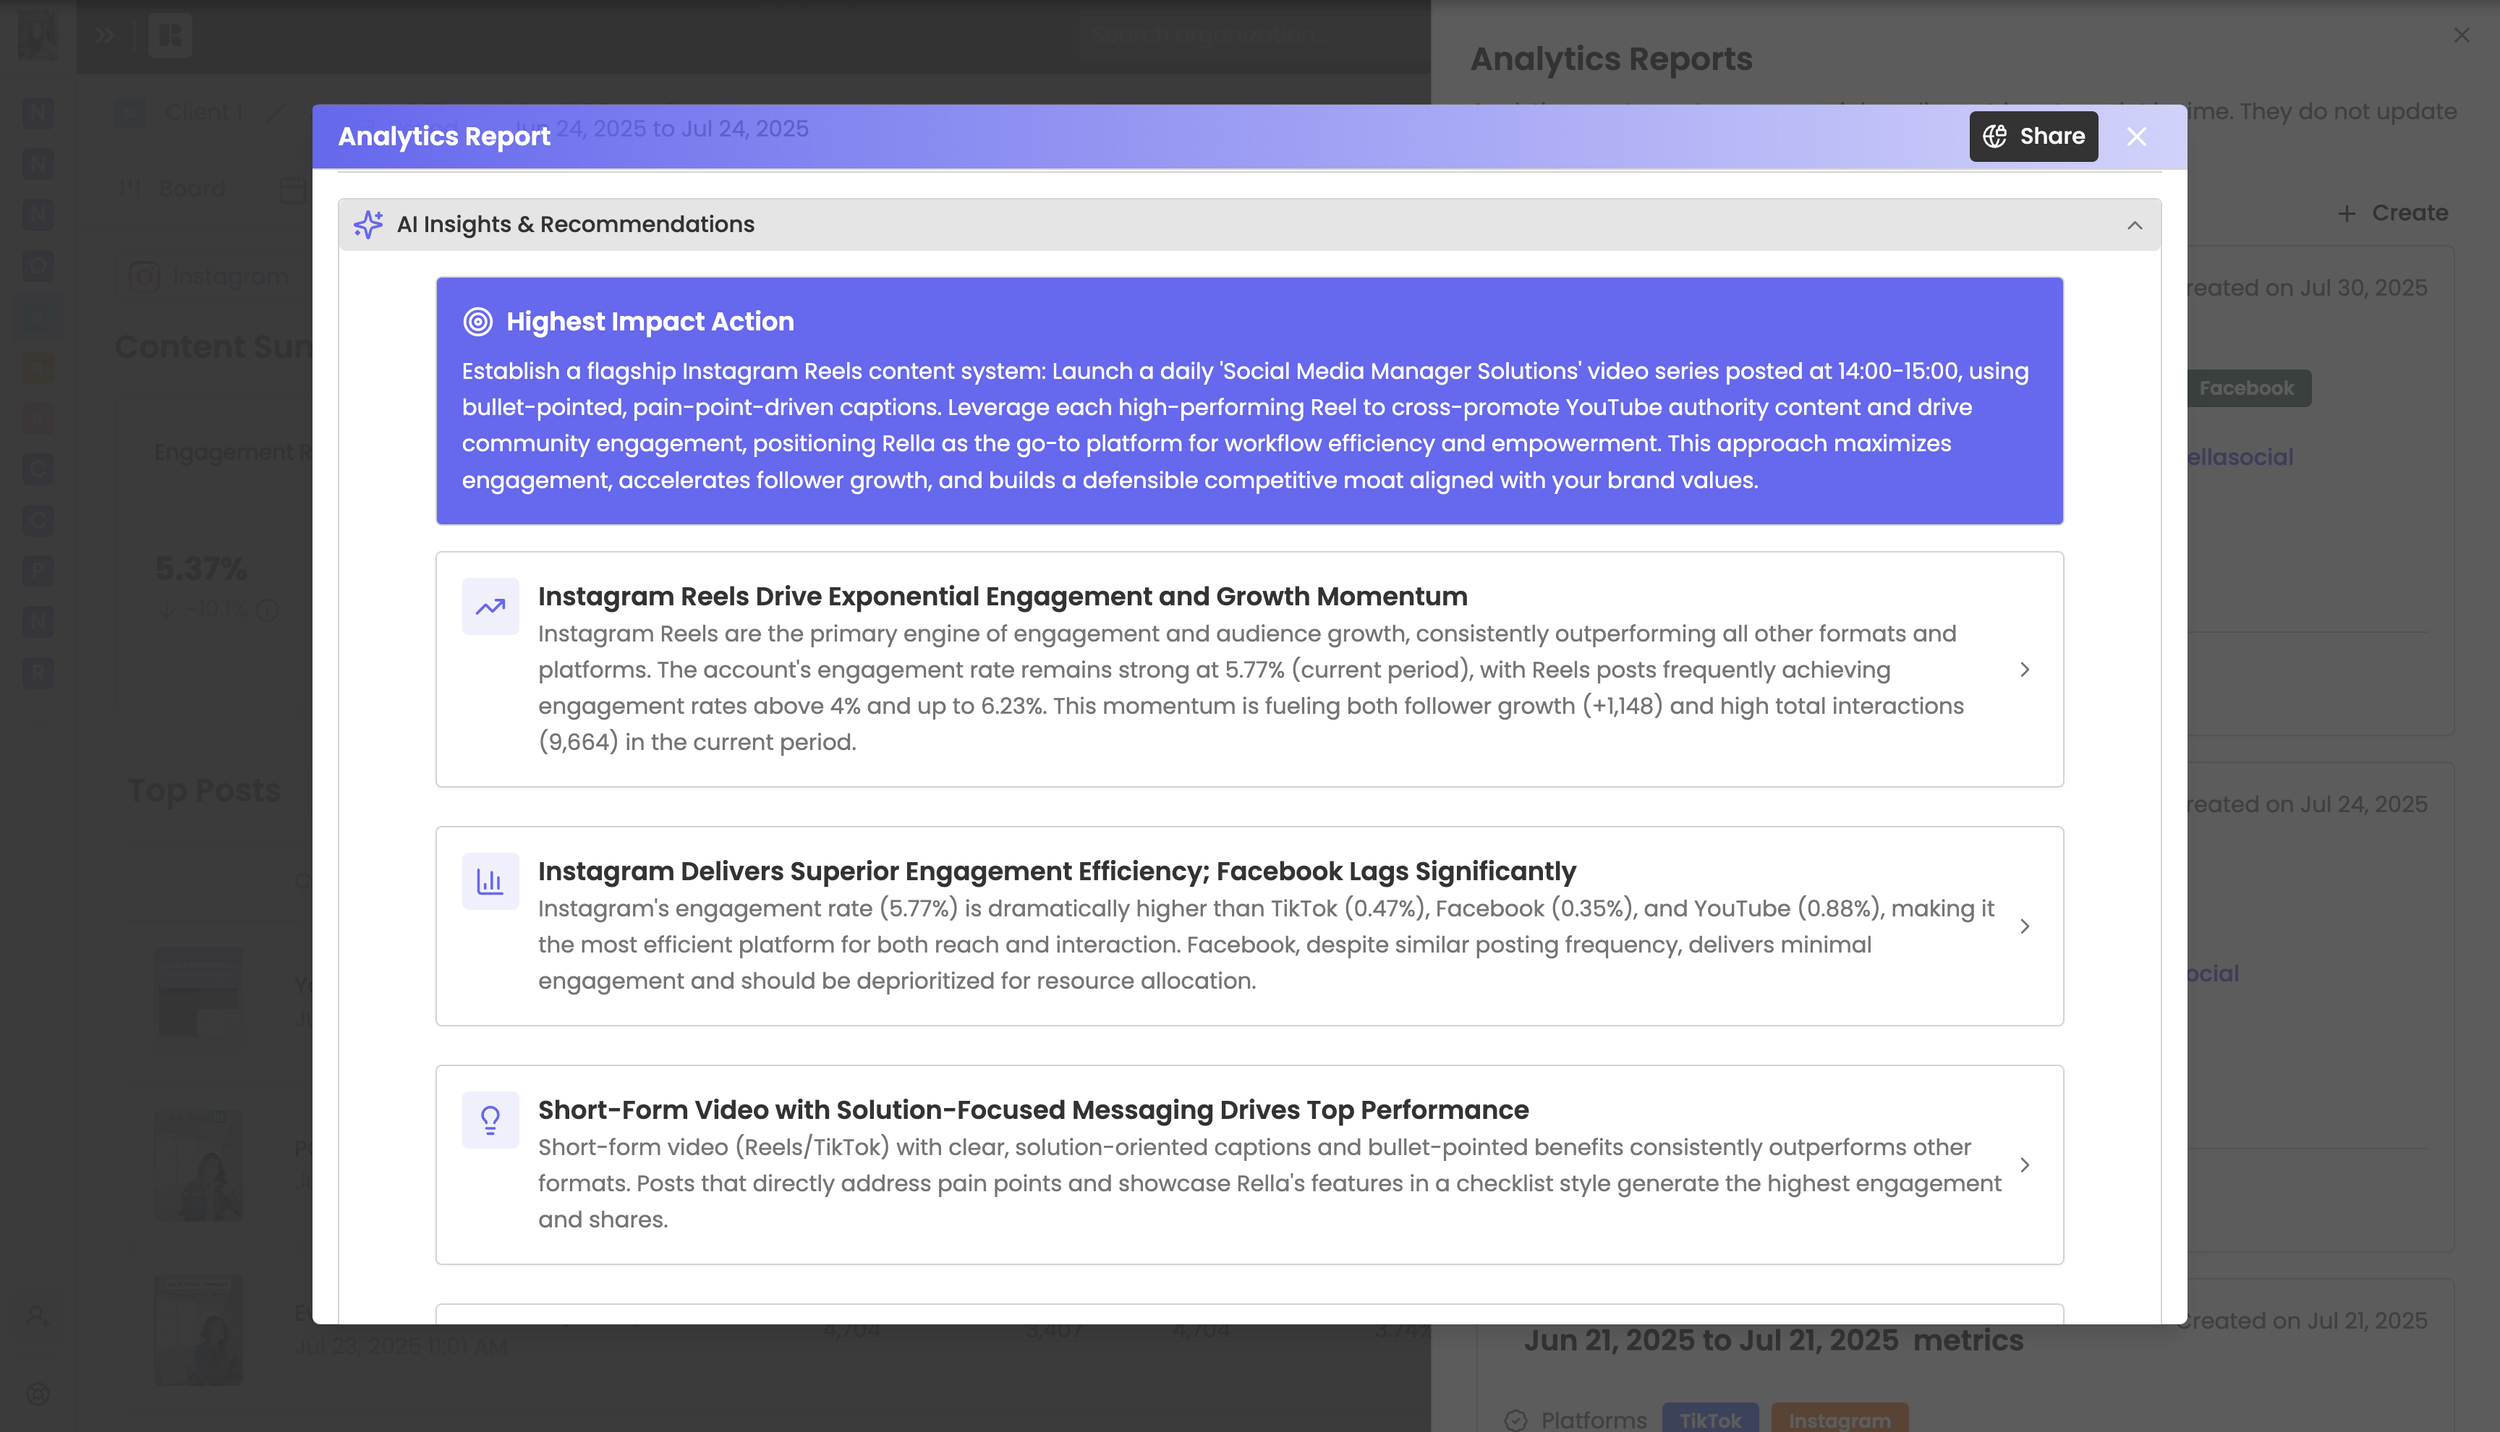
Rella’s built-in AI, Ella, analyzes your cross-platform performance and surfaces actionable recommendations directly within the analytics dashboard. Rather than spending time interpreting raw numbers, Ella does the heavy lifting — identifying trends, flagging high-performing content types, and suggesting strategies to improve results across your connected platforms.
When generating a report, turn on “AI Analysis” to access AI Insights & Recommendations within a report.
Frequently Asked Questions
Can I view analytics for native posts?
Yes, Rella will display metrics for any post published through the connected account, even posts that were not scheduled through Rella.
Do clients need to sign up to view analytics?
No sign up required! Clients can access their analytic reports through the sharable link sent to them without creating a Rella account.
Can I email the report to my client?
Yes, once a report has been created select the email icon to send the report to multiple email addresses.
Can I export analytics reports as a PDF or CSV?
Rella offers shareable reports via links, making it easier to instantly provide clients and team members with real-time access to data! No need to download and send PDF files or CSVs—simply share a link, and clients can view the report immediately without the hassle of extra steps. If you’d like to see this ability on Rella, please vote to receive updates on our Canny board here.
How many reports I can generate?
With Rella, you can generate unlimited analytics reports at no extra cost. Whether you're managing reports for multiple clients or need frequent updates, Rella’s analytics dashboard offers all the flexibility you need.
Can I view competitor insights?
Rella’s AI Assistant, Ella is capable of internet searching!
Do I have to enter my clients email every time?
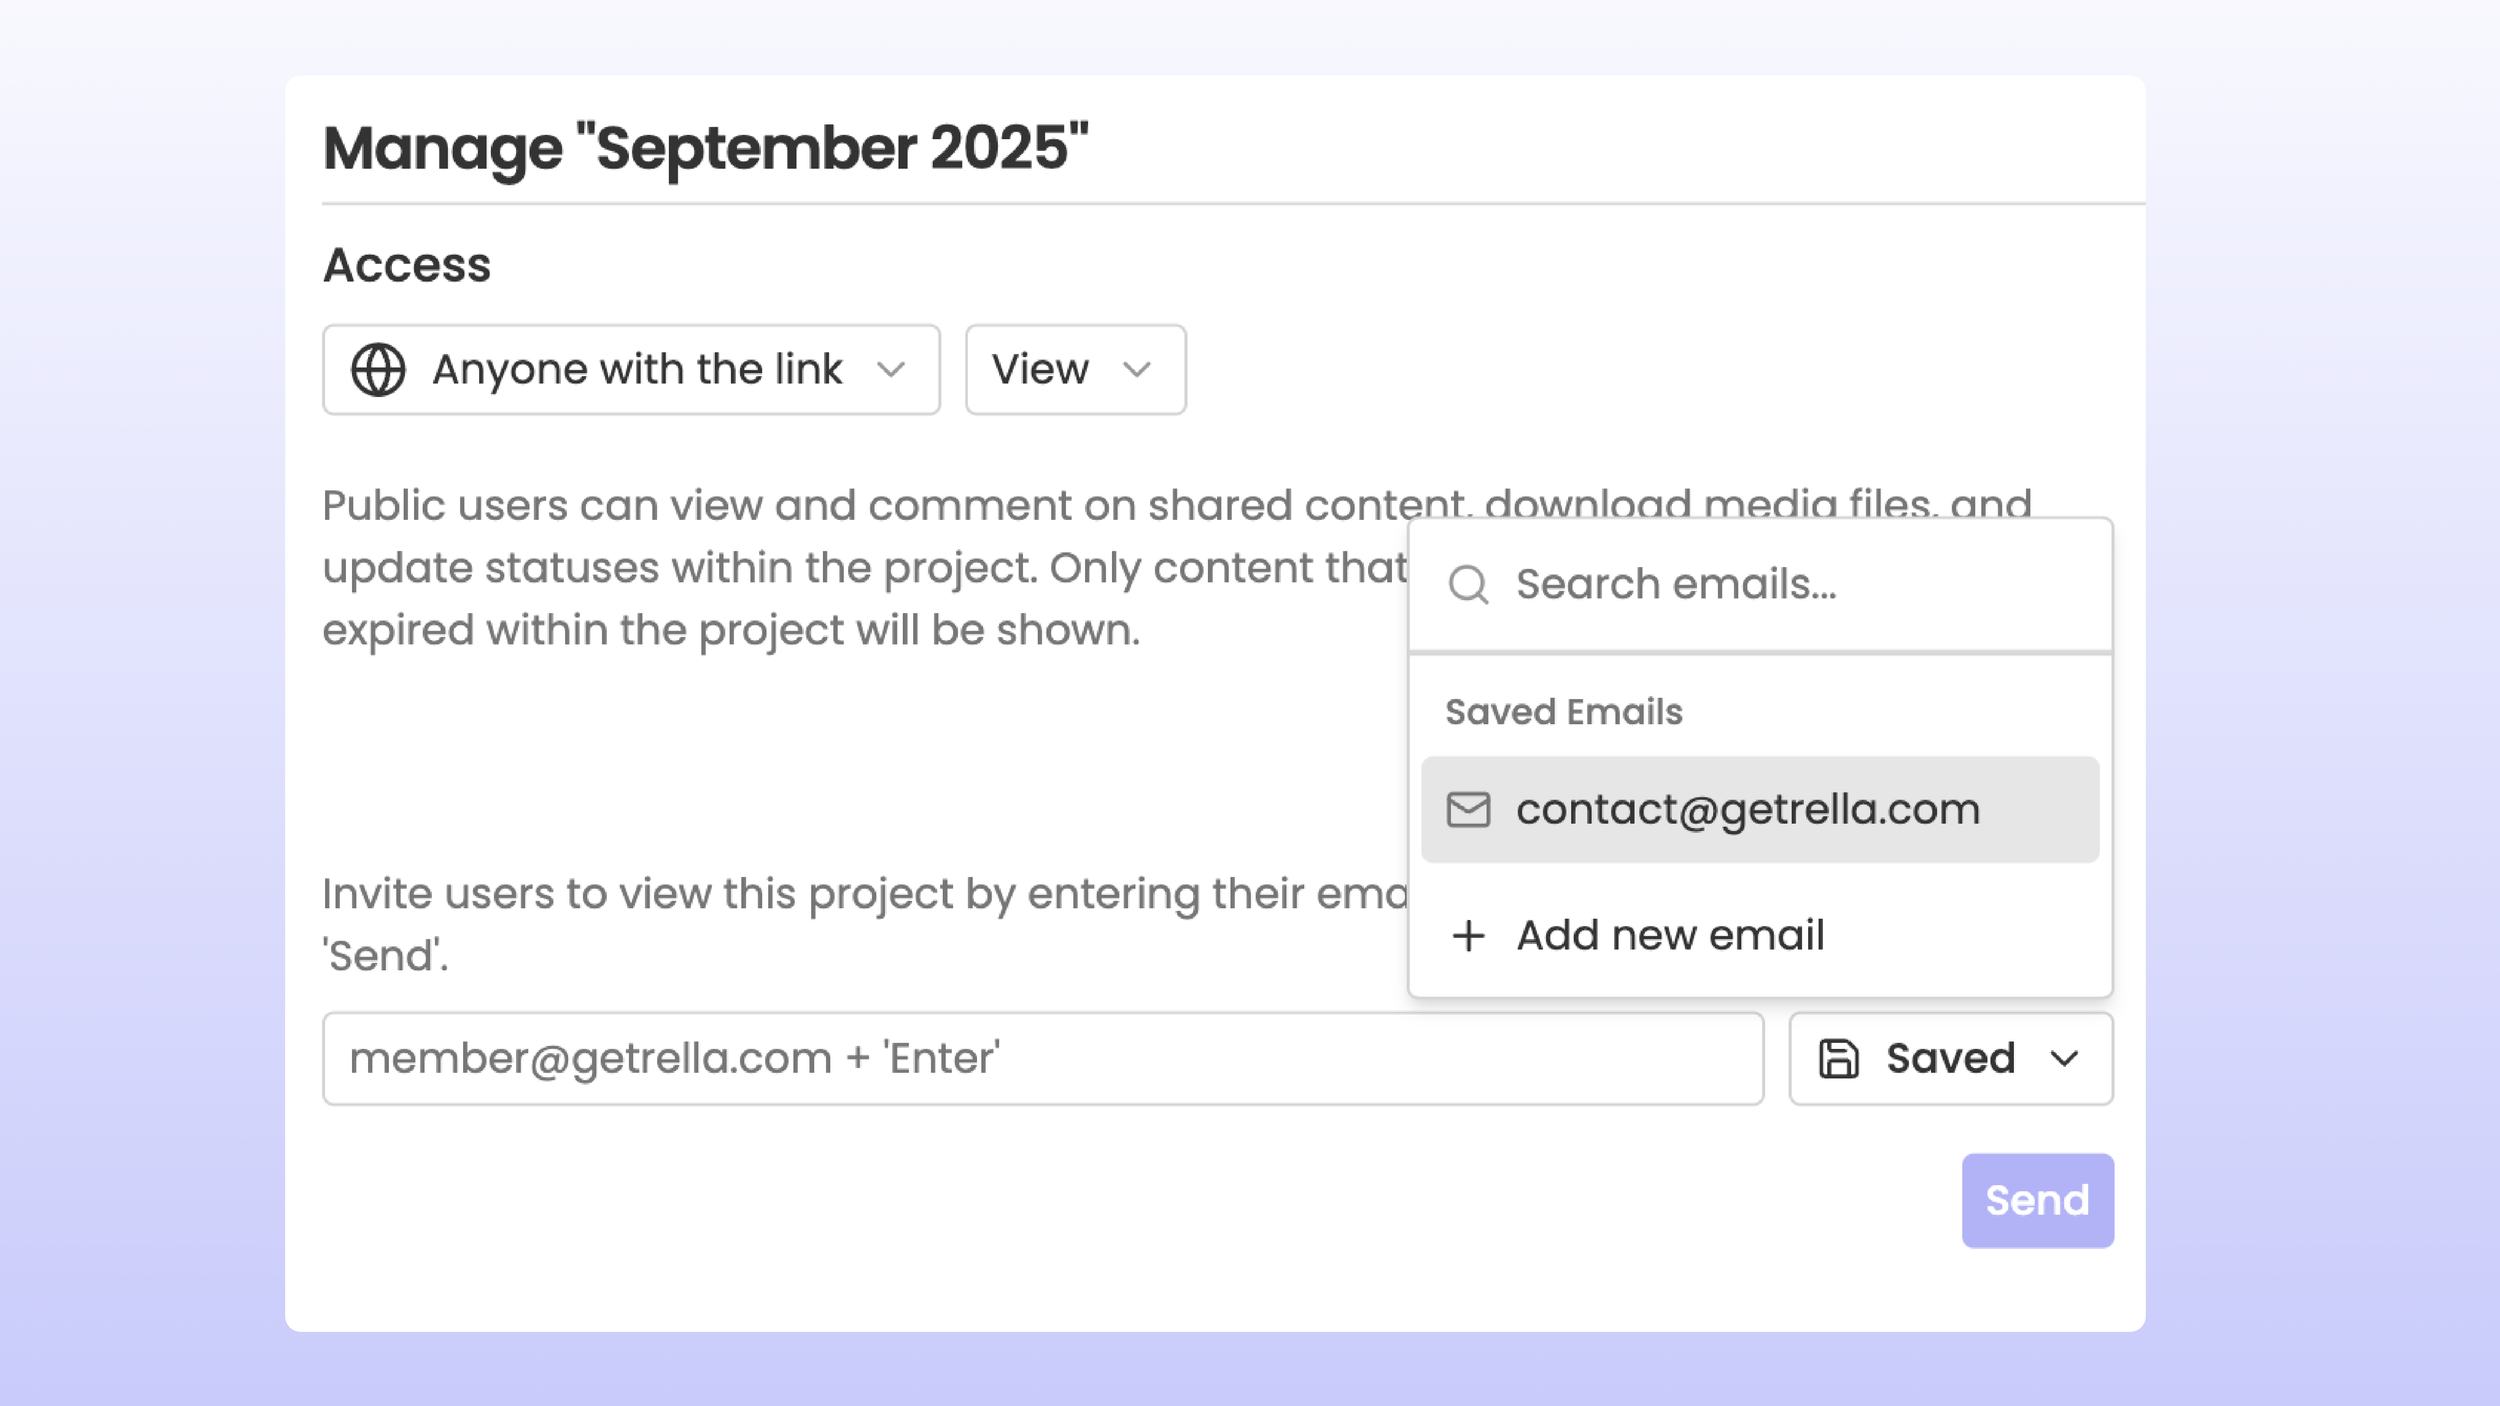
When sharing content, you can choose to bookmark frequently used email address to save time.